How we measure the HPBW of an antenna
The HPBW (Half-Power Beam Width) is the width of the main beam of the antenna's radiation pattern,
measured at the points of half maximum power. The knowledge of the HPBW is important, because it
also tells us how well the antenna dish is illuminated by the feed antenna, thus how efficient
the antenna is, and how high the angular resolution ist, i.e. what minimum angular diameter a radio
source must have in order to be identifiable as a single object. Ideally the HPBW is determined by
measuring the power of a point source (whose angular size is smaller than the HPBW) which is moved
across the front of the antenna.
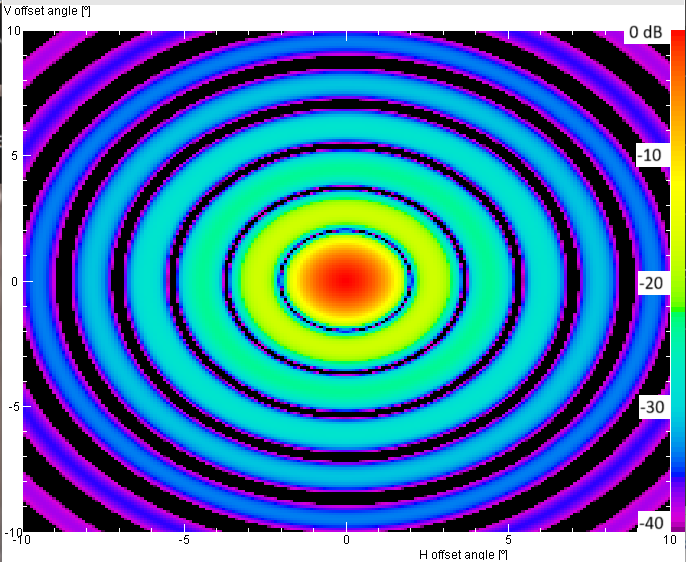
| The theoretical radiation pattern of a circular dish of diameter D which is evenly
illuminated is given by the power transmitted to (or received from) the direction angle
phi; from the central axis of the dish:
p(φ) = [2λ/(πD) * J1((π D /λ)
sin(φ)) / sin(φ) ]²
with the wavelength λ and the first-order Bessel function J1(x).
The main lobe has the width
HPBW = 59°/(D/λ)
- with D and λ given in the same units, e.g. metres.
False colour map of the theoretical radiation pattern of a circular dish of 8 m diameter
at 1.3 GHz.
|
|
When you measure the HPBW, you may compare it with the theoretical HPBW, if the whole dish were
evenly illuminated: we compute from the measured HPBW the effective
diameter Deff = (59°/HPBW) λ
which is the diameter of an evenly illuminated dish that has the measured value of the HPBW.
This also gives you the effective area of the antenna:
Aeff = Deff² π/4
which is the area by which the dish is illuminated, or by which the antenna captures the radio
waves on reception.
The ratio of the effective and true antenna areas - or the square of the ratio of effective
and true antenna diameters - is the (aperture) efficiency:
η = (Deff/D)².
The other important antenna parameter is the (pattern) gain in linear units:
G = 4 π Aeff / λ²
or by using directly the HPBW:
G = (π 59°/HPBW)²
and the gain in dB over the isotropic antenna:
GdBi = 10 * log10(G)
For practical purposes, it is best to use the Sun on its promenade across the sky, as it is at all frequencies
the brightest radio source in the sky, and the perfectly regular rotation of the Earth lets it move in
the sky in a precisely predictable manner. We take a drift scan: we place the antenna to a position
where the Sun will be some time from now, and then measure the power while the Sun passes over the beam.
However, there is a small problem: The Sun with its angular diameter of about 0.5° is not a perfect
point source. Therefore, our method will depend on the width of the beam:
(a) For beams that are much wider than about 0.5° we may consider the Sun as sufficiently small bright spot
in the sky, and thus the curve measured by the drift scan gives directly how the antenna's sensitivity depends
on the angle from the beam centre.
(b) If the beam is narrower than or comparable to the size of the Sun's disc, the curve from the drift scan shows
how the brightness of the Sun varies across its face. But as at the edge of the Sun the brightness makes
a sharp jump from bright to dark, we may use the shape of the solar rims to provide information for the beam width.
Wide beam
|
Making a full drift scan requires an accurate positioning system of the antenna. We place the antenna
to a position, where the Sun will pass some time later. Since the sky moves with 1° in 4 min, you might
choose for a 3° wide beam a position of 9° ahead or 36 min. With the antenna at that position, you
record the measured power. After the maximum, wait until the signal power has come down again to a constant
value ... this is the empty sky. Perhaps you might pick up the side lobes ... thus it is a good idea to move
the antenna horizontally towards the East and measure the empty sky here. You will need this value!
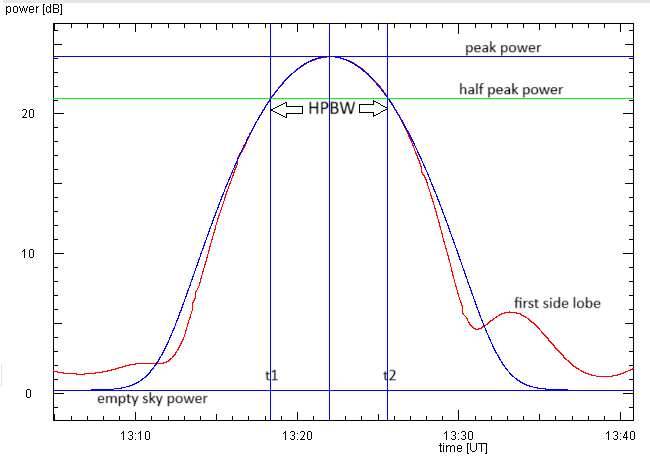
Interpretation: If the data are in dB, convert into linear power values (p = 10dB/10).
The measured powers are the sum of the solar noise and the noise from the Earth atmosphere through which the
radio waves must pass from the Sun to us. Get the average value for the power from the empty sky noise, which
constitutes the zero for the solar powers. Then subtract this value from all measured
powers. Now look for the two points in the flank of the bell-shaped curve, where the power is half of the
maximum power. Convert the time difference between the two points into angles:
HPBW = (t2-t1) * 0.25°/min * cos(decsun)
where decsun is the declination of the Sun (viz. the angle above/below the celestial equator).
The reason for this correction with the declination is that an object at the celestial equator moves across
the sky with the full 0.25°/min, but a source at the pole does not appear to move, because it lies on the
rotational axis of the Earth.
|
Another way is to make a half drift scan:
|
This method takes only half the time. Furthermore it is also useful, if the positioning system of the
antenna is not accurate or not stable to allow placing the antenna to a position. We simply point
the antenna to the Sun, until we get the highest signal. Then we fix the antenna, and start recording
the measured powers, until the power comes down and remains stable at a low value, which would be the
noise from the empty sky. Perhaps you pick
up also the sidelobes. In any case, it is a good idea to move the antenna at the same elevation, well
away from the Sun and measure the empty sky. You will need this value!
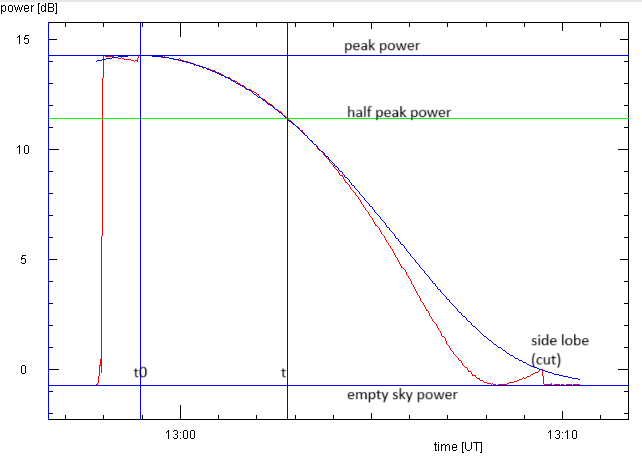
Interpretation: If the data are in dB, convert into linear power values (p = 10dB/10).
Get the average value for the power from the empy sky noise. Then subtract this value from all measured
powers. Now look for the point in the flank of the curve, where the power has dropped to
half of the maximum power. Convert the time between this point and the start time into angles:
HPBW = 2 * (t-t0) * 0.25°/min * cos(decsun)
where decsun is the declination of the Sun (viz. the angle above/below the celestial equator).
|
Narrow beam
|
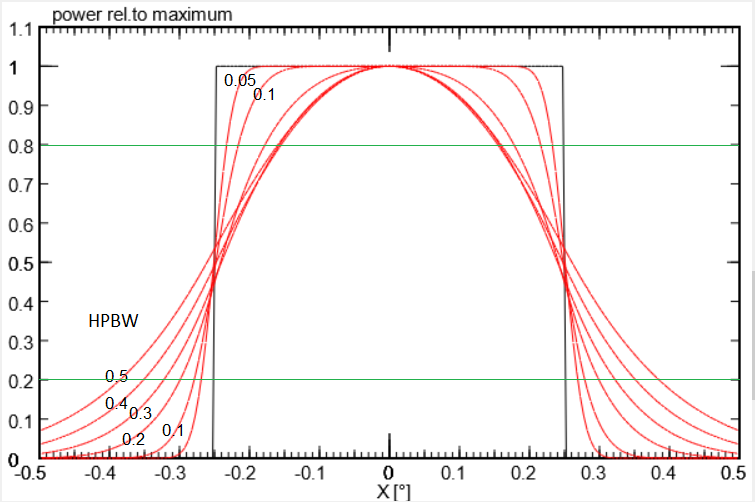
The Sun very closely resembles a uniformly bright disc (black rectangular curve). Viewed by a narrow antenna
beam (HPBW < 0.05°) we see this flat-topped brightness profile. But when viewed with a beam much larger
0.5°, the resulting drift scan curve is a bell-shaped curve, whose shape is determined by the sensitivity
response of the antenna's main lobe, and its width measures directly the antenna HPBW - this is the trick
which permits us to measure the width of wide beams, as used above.
When the HPBW is comparable to the Sun's angular size, the drift scan curve is somewhere between these
limiting cases, and is more complicated to interpret. Luckily, the most prominent change appears at the
solar rims: the sharp drop from maximum to zero intensity is washed out by the antenna beam. The edge
is smoothed out into a gentle decline. Since a wider beam gives a wider profile, we can use the
width of the rim to measure the HPBW. This is done by measuring the time difference between two levels
- for example at 80% and 20%, of the maximum intensity. Then we use the Earth rotation to
get the rim's angular width
rimWidth = (t20 -t80) * 0.25°/min * cos(decsun)
(here for the outgoing (right) rim). The Table below allows us to obtain the HPBW from the rim width and
the chosen flank's level values.
|
The rim widths [in °] of an evenly bright circular disc of 0.5° with sharp edges viewed by
an antenna beam of HPBW between 0.05 and 0.5°, as measured by the angle between the two
points in the flank where the intensity is 15%/85% … 30%/70% of the peak intensity.
| HPBW[°] levels = | 0.15/0.85 | 0.2/0.8 | 0.25/0.75 | 0.3/0.7 |
| 0.05 | 0.043 | 0.035 | 0.028 | 0.022 |
| 0.1 | 0.088 | 0.072 | 0.057 | 0.044 |
| 0.2 | 0.179 | 0.146 | 0.117 | 0.091 |
| 0.3 | 0.244 | 0.200 | 0.161 | 0.126 |
| 0.4 | 0.293 | 0.240 | 0.193 | 0.151 |
| 0.5 | 0.341 | 0.279 | 0.225 | 0.176 |
| 1.0 | 0.610 | 0.500 | 0.402 | 0.313 |
The table is computed with a version of the Javascript tool
LunarDriftScans which
is available on the internet. This script predicts the radio image of the Moon for any frequency and lunar phase,
and shows for any antenna beam width the expected drift scan plot. It also computes the widths of the lunar rims
using the pair of points at the specified level. Thus, it may also be used to interpret your data, especially of the
Moon whose radio face changes with lunar phase and frequency.
Note: For the interpretation of solar drift scan, you simply choose a low frequency (1 GHz), to make the Moon's face
as uniformly bright as the Sun's disc.
See DUBUS 2/2023, 6.
|
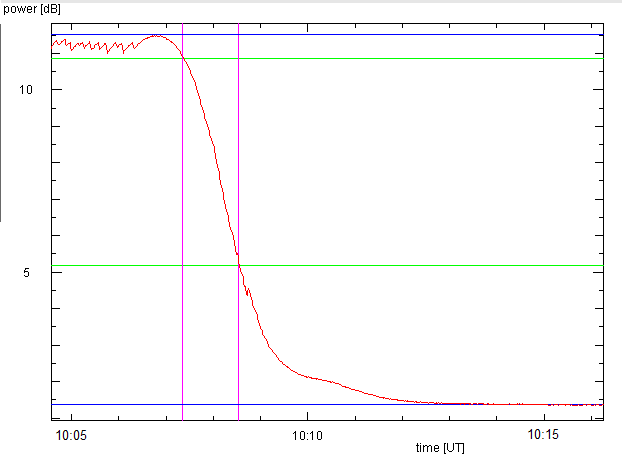
This is a half drift scan of the Sun taken with the 3.7m dish on 24 GHz in 2014.
We first search for the maximum signal from the Sun, then move the antenna a little
bit to the West and stop the tracking to let the Sun drift over the antenna beam.
The blue lines indicate the intensities of the Sun and the empty sky (which gives
the zero solar intensity), the green lines mark the 15% and 85% levels.
The rim width of 0.28° gives a HPBW of 0.38°.
Using the AntennaCalc tool
we find that a uniformly illuminated 3.7 m dish would have a HPBW of 0.2°. This implies that
the antenna has an aperture efficiency of only 28%, or that it has an effective diameter
of only 2 m. Measurements with the Moon gave the same very disappointing values.
|
|
There is a long story about the 3.7m dish on 24 GHz. In 2014 the HPBW was measured as 0.38°.
This implies that the antenna has an aperture efficiency of only 28%, or an effective diameter
of only 2 m. Also, the Sun was about 10 dB over the empty sky, and the Moon 0.7 dB. Obviously
this was not something to be content with ... Eventually, a new feed was installed and other
improvements were made ...
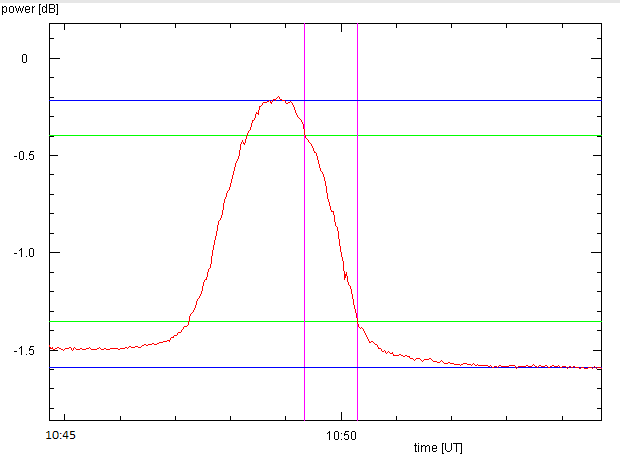
The measurements in 2021 – it may suffice to show only the Moon scan –
revealed substantial improvements: The Sun is now 13.5 dB over the empty sky, the Moon 1.4 dB.
Both Sun and Moon give rim widths of 0.22°, which means 0.26° HPBW. The aperture efficiency
is 60%, the effective diameter 2.9 m. The gain is 57.2 dBi, a great improvement over 53.8 dBi in 2014.
Unfortunately, a temperature sensitive amplifier for the long cable in the i.f. chain caused
an annoying gain drift.
Here, we analyze only one rim.
|