The radiation pattern describes what fraction of the input power is radiated away in
what direction. For reception it is the sensitvity of the antenna, which means how
strong a signal from a certain direction is picked up. In the principal direction -
the central axis of a paraboloidal mirror - the sensitivity and the radiated power
is largest: the main lobe, into which most of the transmitted power is bundled.
With increasing angle from the main direction the emitted power decreases. As the
Half Power Beam Width (HPBW) we designate the angular width between the points where
the power has dropped to one half. At larger angles the power will increase and decrease
again, which results in a series of side lobes, which are grouped like concentric
rings around the main lobe.
Most of the power fed into the antenna is given off in the main lobe, but a certain
amount is radiated away in other directions. On reception these side lobes
can pickup interference signals and noise.
In a well-adjusted antenna, the side lobes are much less important, as one does not
want to lose too much power in them when transmitting, or to pick up too much ambient noise by them.
As the number and position of the sides lobes are connected with the HPBW of the main lobe,
counting the side lobes serves as a useful check on the measured value of the HPBW.
See DUBUS 4/217, 27; Technik XVI, 68.

|
The theoretical radiation pattern of a circular dish of diameter D which is evenly illuminated
is given by the power transmitted to (or received from) the direction angle phi; from the
central axis of the dish:
p(φ) = [2λ/(πD) * J1((π D /λ) sin(φ))
/ sin(φ) ]²
with the wavelength λ and the first-order Bessel function J1(x).
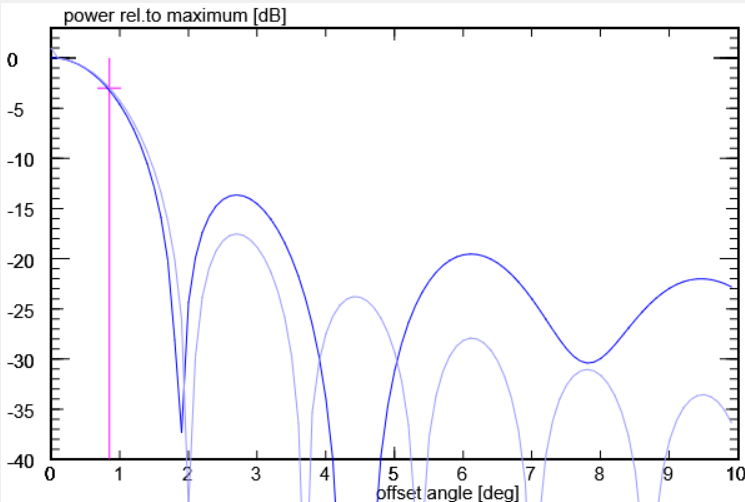
The blue curve is the pattern of a 10m diameter dish at 1.4 GHz. The red curve is what would be measured
by letting the Sun drift across the pattern. Since the HPBW of about 1.3° is much larger than the
Sun's angular diameter of 0.5°, the two curves are very similar, and hence we may regard the Sun
as a point source for this antenna. The grey curve shows the solar brightness which is constant
across its disc. The small red cross marks the angle for the half-power point. The first side lobe is
about 18 dB below the main lobe. There are three side lobes within 5° of the central axis.
This and the following plots are computed with the JavaScript tool
AntennaPattern.
|

|
At twice the frequency, the pattern of the same antenna is correspondingly narrower:
The HPBW of 0.6° is only slightly larger than the Sun, and there are almost 8 side lobes
within 5°. The bumps of the red curve not longer follow the maxima of the blue curve;
they are less prominent and tend to be further out.
|

|
At still a higher frequency, say 14 GHz, this dish has a HPBW of 0.13°, and the first three
side lobes lie within 0.5°. As the main lobe is narrower than the solar disc (grey curve),
a drift scan (red curve) gets us a flat-topped profile, the half-power point (red cross) occurs
at the solar rim, and the bumps from the side lobes are shifted away
from the true pattern's maxima. This makes an interpretation of the data for the radiation
pattern very difficult.
|
The 9m dish at DL0SHF

|
The raw data from a long drift scan of the Sun: to capture the side lobes on the
eastern (left) side, the antenna was placed where the Sun would be half an hour later.
It would certainly have been better to choose an even later position!
While the main lobe appears nicely symmetrical, the side lobes are not: on the
outgoing (western) side, they are much stronger. The first side lobe is about
11 dB below the main lobe.
|

|
The drift scan data at 1.3 GHz, with peak power and empty sky power levels
marked and with the times (relative to the time of the peak) converted into
angles of the Sun centre from the main lobe centre, via the Earth rotation, using:
angle = (t-tpeak) * 0.25°/min * cos(decsun)
where decsun is the declination of the Sun
(viz. its angle above/below the celestial equator).
The power from the empty sky, which defines the zero level for the
Sun signal's power is about 1 dB, thus the Sun is 15 dB above the empty sky at the same elevation,
or the Sun ist 30 times brighter than the nearby sky.
From the crossing points of the green lines with the red curve we read off the HPBW = 1.7°
With AntennaPattern.
this gives an effective diameter Deff = 8 m. Therefore we expect five side lobes
within 10°.
|

|
To get the true pattern with the proper heights of the side lobes, we have to consider
the true power received from the Sun, and we must subtract the power of the empty sky. As
the data are given in dB, this is a little bit tedious. The power from the Sun
measured when it was at angle from the main lobe's centre is:
p(angle) = 10pdB(sun)/10 - 10pdB(sky)/10
As we wish to express the pattern in dB, but now normalized to the main lobe centre,
we then compute
pdB(angle) = 10* log10(p(angle))
The first right (western) side lobe is 13 dB below the main lobe. This is a bit more
than it had appeared from the first look at the raw data, because of the
correct subtraction of the empty sky's noise power.
|

|
Now let us compare the measured pattern (red curve) with the theoretical pattern
of an evenly illuminated dish of 8 m diameter which matches
the measured HBPW of 1.7° (blue curve).
The main beam is well represented, as is the position of the first side lobe.
All side lobes in the measured pattern are much stronger than the theoretical
pattern. Also, where one would expect the second side lobe, there is a deep
minimum. From theory we would expect 5 side lobes within 10°, but we measure
only three ...
|
|
The explanation is rather simple: The feed antenna in the prime focus is a metallic
assembly of about 50 cm diameter. It obscures the radiating beam which comes from the reflecting
surface of the mirror. A simulation with
AntennaPatternObscured
shows that in the pattern of an 8 m dish on 1.3 GHz with a central blockage by a 50 cm
large feed the second and fourth side lobes are weaker, but the first, third and fifth lobes
become stronger (thick blue curve) than in the unobscured dish (light blue curve).
Thus, we seem to see only three side lobes within 10°. Obviously, some fine tuning of
parameters and inclusion of the feed's shape would be able to explain the measured pattern.
See DUBUS 1/2018, 15; Technik XVII, 10.
|